


The Buildings, Safety Engineering & Environmental Department hosts Detroit Community Air Quality Training
Detroit Air Quality Monitoring
block-detroitminew-views-block-news-events-block-1,News & Events*block-detroitminew-views-block-related-links-block-1,Related Links*block-detroitminew-views-block-video-playlist-block-1,Videos*documents-block,Documents*block-detroitminew-views-block-forms-block-1,Forms*block-views-block-faq-block-1,FAQs*block-detroitminew-views-block-district-map-block-1,District Map*block-views-block-council-office-directory-block-1,Office Directory*block-detroitminew-views-block-contacts-block-3,Contacts*block-detroitminew-views-block-contacts-block-4,Contacts*block-detroitminew-views-block-council-member-bio-block-1,Bio*block-detroitminew-views-block-sub-sections-block-1,Sections*block-detroitminew-views-block-web-apps-block-1,Web Apps*block-detroitminew-views-block-news-events-block-4,News*block-detroitminew-views-block-news-events-block-3-2,Events*block-detroitminew-views-block-contacts-special-block-1,Staff*block-detroitminew-views-block-statements-block-1,Statements*block-detroitminew-views-block-newsletters-block-1,Newsletters*block-detroitminew-views-block-newsletters-block-3,Ordinance*block-detroitminew-views-block-newsletters-block-2,Resolutions*block-detroitminew-views-block-newsletters-block-4,Memos
Welcome to the Detroit Air Quality Center
This site is a centralized collection of air quality monitoring efforts and information from the City of Detroit. On this page, you can interact with our dashboard for real-time air quality monitoring data across the city, stay up-to-date on current and past air quality, explore additional resources, and read and learn more about air quality monitoring, regulations, and human health.
Upcoming City of Detroit 2nd Quarter 2026 training dates:
June 3: District 3 at Farwell Recreation Center 6-8 PM
June 4: District 2 atNorthwest Activities Center 6-8 PM
June 11: District 4 at Community Center at AB Ford 6-8 PM
June 15: District 5 at Green Door Initiative 6-8 PM
June 17: District 6 at Kemeny Recreation Center 6-8 PM
June 22: District 1 at Crowell Recreation Center 6-8 PM
June 25: District 7 at Adams Butzel Complex 6-8 PM
RSVP for any of the events here.
Click here for the Detroit Air Quality Dashbord
City of Detroit Air Quality Center
The City of Detroit has installed seven Teledyne T640x air quality monitors at fixed locations across the city to measure real-time particulate matter (PM) in the air. This dashboard uses air quality data measured at city monitors to present a real-time and historical look at air quality across the city, provide additional data to manage and regulate air quality in the region, and present an opportunity to educate the public on the intersection of air quality, public health, and environmental policy. This air quality monitoring project seeks to supplement existing monitoring efforts in Detroit from the State of Michigan Department of Environment, Great Lakes, and Energy (EGLE), Wayne County, and low-cost sensors from residents and community group, and aims to collectively provide coverage across every Detroit City Council district.
To view the existing regulatory monitors (concentrated primarily in Southwest Detroit). please visit EGLE MiAir page, and additional monitors and sensors can be found below in the "Additional Air Quality Resources" section.
In the dashboard, air quality data is presented both as concentration data (in micrograms per cubic meter) for particulate matter (categorized by size as PM10 and PM2.5), and as an air quality index (AQI) for PM. The AQI is EPA’s tool for categorizing and communicating air quality into levels of health concern, with specific information for which groups of people may be affected and preventative measures to reduce exposure.1 Historical AQI data presents a 24-hour average, meaning the AQI at the end of a given day (midnight) will give a representative value for the air quality over the full course of the day. Real-time AQI reporting is calculated using EPA’s NowCast methodology, which uses an algorithm using hourly readings to calculate a NowCast AQI using a weighted average of the previous 12 hours.2
It should be note that real-time and downloaded data are preliminary and subject to change, and monthly QA/QC reports will be posted that include data validation and any data corrections that were made (e.g. for periods of maintenance or calibration).
The dashboard presents the locations of the monitors, and various ways to interact with the data:
- Filter the data by the pollutant of choice (PM2.5 or PM10) and by calendar month
- View the most recent AQI value and category measured at each monitor location
- Hover over a monitor location to view current-day NowCast AQI trends
- Click on individual monitors to filter the data to that location, including the calendar and AQI category bar
- Hover over a calendar day to see a graph displaying daily trends across monitors, or at an individual monitor if an individual monitor has been clicked on
Click HERE to view the Detroit Air Quality Dashboard
Click HERE to access the Open Data Download of Detroit Air Quality Data
The Clean Air Act (CAA) plays a critical role in regulating air quality. The CAA established National Ambient Air Quality Standards (NAAQS) designed to protect public health and the environment from harmful effects of air pollution. The EPA sets NAAQS for six major pollutants referred to as “criteria pollutants”. Primary standards are designed to protect public health, including the health of sensitive populations such as children, the elderly and people with respiratory conditions like asthma. Secondary standards are aimed at protecting public welfare. This includes safeguarding the environment, preventing damage to vegetation, wildlife and buildings, and reducing issues like decreased visibility caused by air pollution.
Pollutant | Primary/ | Averaging Time | Level | Form | |
primary | 8 hours | 9 ppm | Not to be exceeded more than once per year | ||
1 hour | 35 ppm | ||||
primary and | Rolling 3 month average | 0.15 μg/m3 (1) | Not to be exceeded | ||
primary | 1 hour | 100 ppb | 98th percentile of 1-hour daily maximum concentrations, averaged over 3 years | ||
primary and | 1 year | 53 ppb (2) | Annual Mean | ||
primary and | 8 hours | 0.070 ppm (3) | Annual fourth-highest daily maximum 8-hour concentration, averaged over 3 years | ||
PM2.5 | primary | 1 year | 9.0 μg/m3 | annual mean, averaged over 3 years | |
secondary | 1 year | 15.0 μg/m3 | annual mean, averaged over 3 years | ||
primary and | 24 hours | 35 μg/m3 | 98th percentile, averaged over 3 years | ||
PM10 | primary and | 24 hours | 150 μg/m3 | Not to be exceeded more than once per year on average over 3 years | |
primary | 1 hour | 75 ppb (4) | 99th percentile of 1-hour daily maximum concentrations, averaged over 3 years | ||
secondary | 1 year | 10 ppb | annual mean, averaged over 3 years | ||
Criteria Air Pollutants
Carbon Monoxide (CO)
Typical sources of CO in ambient air include vehicles and other machinery that burn fuel. CO is a colorless, odorless gas that can be harmful when inhaled in large amounts, more likely in enclosed or indoor environments than outdoor ambient air.
Lead (Pb)
Major sources of lead in ambient air include ore and metals processing, leaded aviation fuel, waste incinerators, utilities, lead-acid battery manufacturing, and smelters. Lead can adversely affect the nervous system, kidneys, immune system, reproductive and development systems, and the cardiovascular system. Most susceptible population are children and infants, with neurological effects including behavioral problems, learning deficits and lowered IQ.
Nitrogen dioxide (NO2)
NO2 primarily gets in the air from the burning of fuel, including from emissions from cars, trucks and buses, power plants, and off-road equipment. Exposure to NO2 over short periods can aggravate respiratory diseases, particularly asthma, leading to respiratory symptoms (such as coughing, wheezing or difficulty breathing), hospital admissions and visits to emergency rooms. Longer exposures to elevated concentrations of NO2 may contribute to the development of asthma and potentially increase susceptibility to respiratory infections. NO2 along with other NOx reacts with other chemicals in the air to form both particulate matter and ozone.
Ozone (O3)
Ozone is not emitted directly into the air; it is created when certain pollutants emitted by cars, power plants, industrial boilers, refineries, chemical plants, and other sources chemically react with sunlight. Depending on the level of exposure, ozone can cause coughing and sore or scratchy throat, make it more difficult to breathe deeply and vigorously and cause pain when taking a deep breath, aggravate lung diseases such as asthma, emphysema, and chronic bronchitis. Long-term exposure to ozone is linked to aggravation of asthma and is likely to be a contributing cause of asthma development,
Particulate Matter (PM10 and PM2.5)
Particulate matter (PM) is a mixture of solid particles and liquid droplets found in the air, categorized by size: PM10- PM with aerodynamic diameter of 10 micrometers or smaller, and PM2.5- particles less than 2.5 micrometers in aerodynamic diameter. PM10 sources can include dust, pollen, and mold, while PM2.5 comprises of particles that are typically products of combustion. Particulate matter contains microscopic solids or liquid droplets that are so small that they can be inhaled and cause serious health problems. PM can be emitted directly from a source, such as construction sites, unpaved roads, fields, smokestacks or fires, or formed within the atmosphere as a result of chemical reactions, including sulfur dioxide and nitrogen oxides. Particulate less than 10 micrometers in diameter can get deep into your lungs and some may even get into your bloodstream. Of these, PM2.5 or fine particulate pose the greatest risk to health.
Sulfur Dioxide (SO2)
The largest source of SO2 in the air is the burning of fossil fuels by power plants, industrial facilities, or mobile sources such as trains, ships or heavy machinery. Short-term exposures to SO2 can harm the human respiratory system and make breathing difficult. People with asthma, particularly children, are sensitive to these effects of SO2 . SO2 can also react to form particulate matter in the atmosphere, or can also form acid rain.
City of Detroit Air Quality 1st Quarter Training Presentation
Air Quality Index (AQI)
AQI is EPA’s tool for categorizing and communicating air quality into levels of health concern, with specific information for which groups of people may be affected and preventative measures to reduce exposure.(4) The AQI includes six color-coded categories providing a different level of health concern, each corresponding to a range of index values. Each category provides additional information regarding protection of public health, including direction for specific subsets of the population.
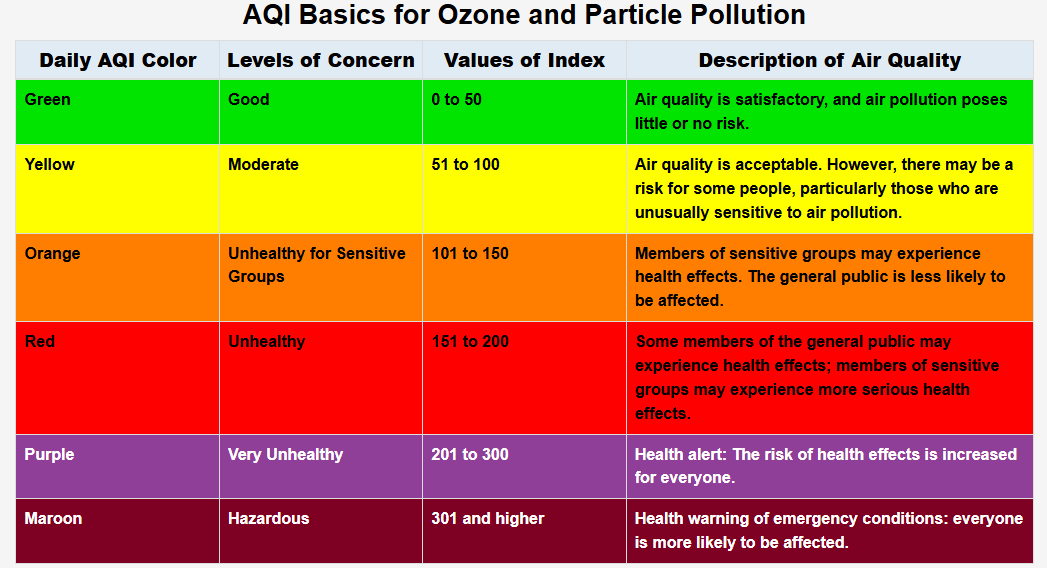
U.S. EPA, available at: https://www.airnow.gov/aqi/aqi-basics/
Additional Air Quality Resources:
State of Michigan Air Quality Division MiAir: Michigan-wide Dashboard, including monitors within Detroit
JustAir: Dashboard providing air quality information from Wayne County monitors, Green Door Initiative monitors, and Wayne County Port Authority.
Meet the Monitors
Teledyne T640x
This is a real-time, continuous particulate matter (PM) mass monitor that measures PM 2.5, 10, and coarse PM (the difference between PM10 and PM2.5) in the ambient air. This is a certified federal equivalent method (FEM) monitor. FEM monitors measure to the equivalent level to federal reference monitors, highly accurate monitors approved by the EPA to measure compliance with National Ambient Air Quality Standards (NAAQS). The data obtained from FEM's are held to rigorous quality assurance standards.
TSP Sampler
A total suspended particulate (TSP) sampler is used for the collection of particulate matter in ambient air with no preference to size selection. Air is passed through a filter which is then analyzed for specific materials such as metals.
Clarity Monitor Solar-Powered, Real Time Portable Monitor
These low-cost, solar-powered monitors measure PM2.5 and PM10, and are placed in areas where the city needs more information on the air quality. These monitors can be used to measure pollutant levels within communities or monitor hot spots.